How to Use Spark - Minecraft
Spark is a powerful performance profiling plugin for Minecraft servers, designed to help server admins diagnose memory issues, disk usage, memory issues, lag, optimize performance, better understand how their server is running, and help track your overall server health.
It's especially useful for larger or heavily modded servers where performance can quickly become an issue. In this guide, we'll show you how to use Spark Minecraft and get more detailed insights into server threads and method calls, making it easier to identify any performance issues.
Don't already host with us? 10,000+ server owners trust Sparked Host for lag-free Minecraft worlds. Claim your server savings to get higher performance at less $ per month.
Key Features of Spark:
- Real-time profiling of server performance, including ticks per second (TPS), CPU usage, and memory
- Lag diagnostics with detailed reports showing what’s causing delays (e.g. entities, chunk loading, plugins)
- Heap dumps and thread dumps for advanced debugging
- Integration with Fabric, Forge, Bukkit, and other server platforms
- Web-based interface that make reports easier to read and share with support
Spark is often used alongside optimization mods like Lithium or Paper to identify and fix performance bottlenecks. It’s an essential tool for anyone running a serious Minecraft server.
Installing The Spark Plugin
To install Spark on a Minecraft server:
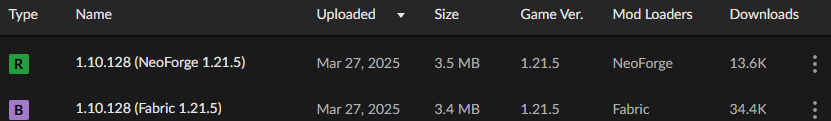
- Go to the downloads webpage of the Spark mod, search for your current Minecraft server version. Check the title of the download name to make sure that the Spark version is the correct version for your server software. (Fabric or Forge)
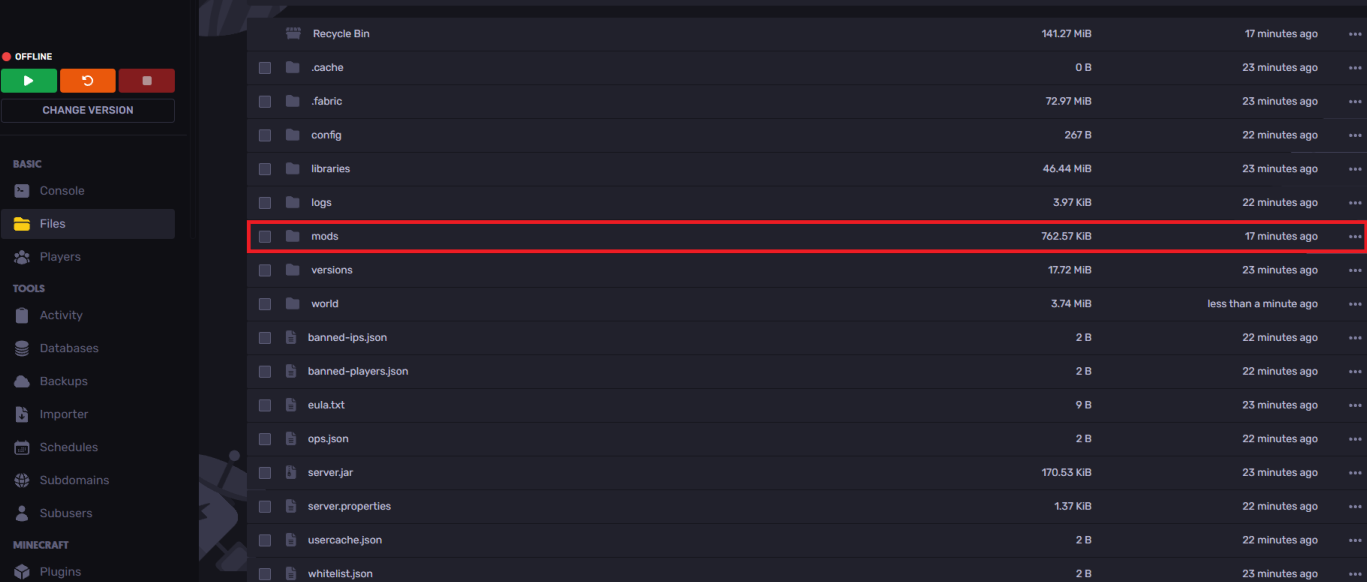
- After downloading Spark, open the Files tab and navigate to the mods folder
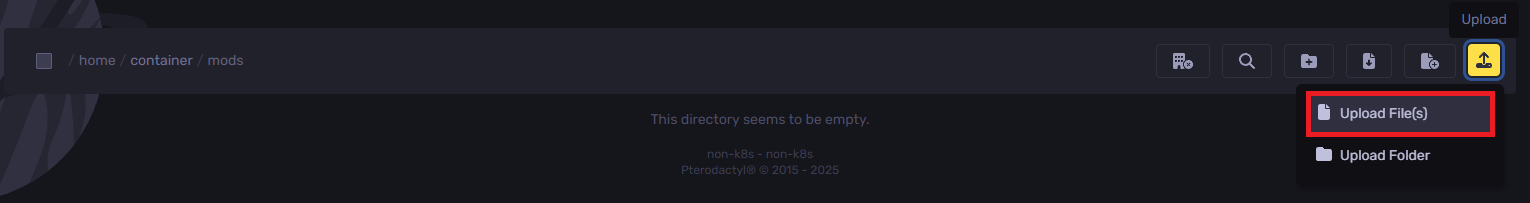
- Upload or drag and drop the installed jar file into the mods folder
You've now installed the Spark plugin successfully.
How to Use Spark Plugin
How to use Spark on your Minecraft Server Spark:
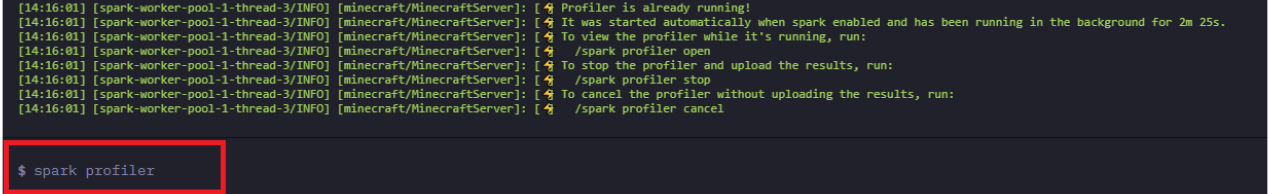
- After installing, use the
spark profilercommand in the console, as shown in the image.
- Wait for 10 minutes after using this command, then use the
spark profiler --stopcommand.
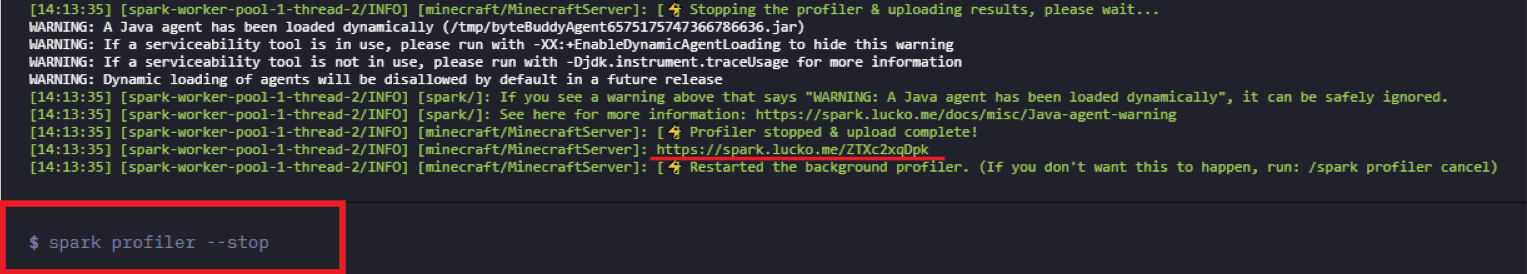
After using the stop command, you will be given a link in the console. After clicking the link, you will be redirected to a page with your tick times report.
How to Create a Timings Report Using The Spark Profiler
To start a reading and manage a reading using Spark, you are able to do the following commands:
/spark profiler start- to start the profiler in the default operation mode.
/spark profiler stop- to stop the profiler and view the results.
/spark profiler info- to check the current status of the profiler.
There are some additional flags which can be used to customize the behaviour of the Spark profiler. You can use:
/spark profiler start --timeout <seconds>- to start the profiler and automatically stop it after x seconds.
/spark profiler start --thread *- to start the profiler and track all threads.
/spark profiler start --alloc- to start the profiler and profile memory allocations (memory pressure) instead of CPU usage.
If you currently are in a ticket due to server lag, feel free to hand over the timings report link to our staff team, otherwise, a more in depth explanation of the profiler can be found at the Spark documentation page.
How to Send a Spark Timings Report to Support
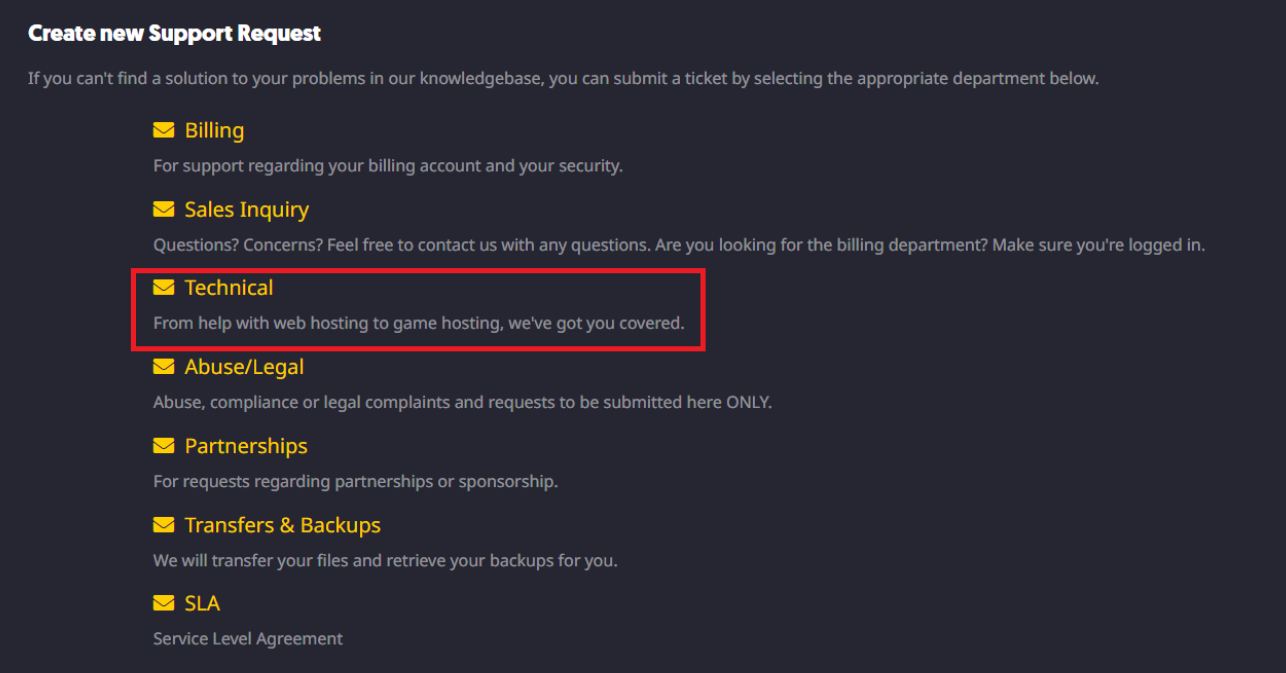
To send a Spark Timings report to Sparked Host support:
- Open a "Technical" ticket here
- Provide us with a message about your issue and the Timings report you've created and hit submit
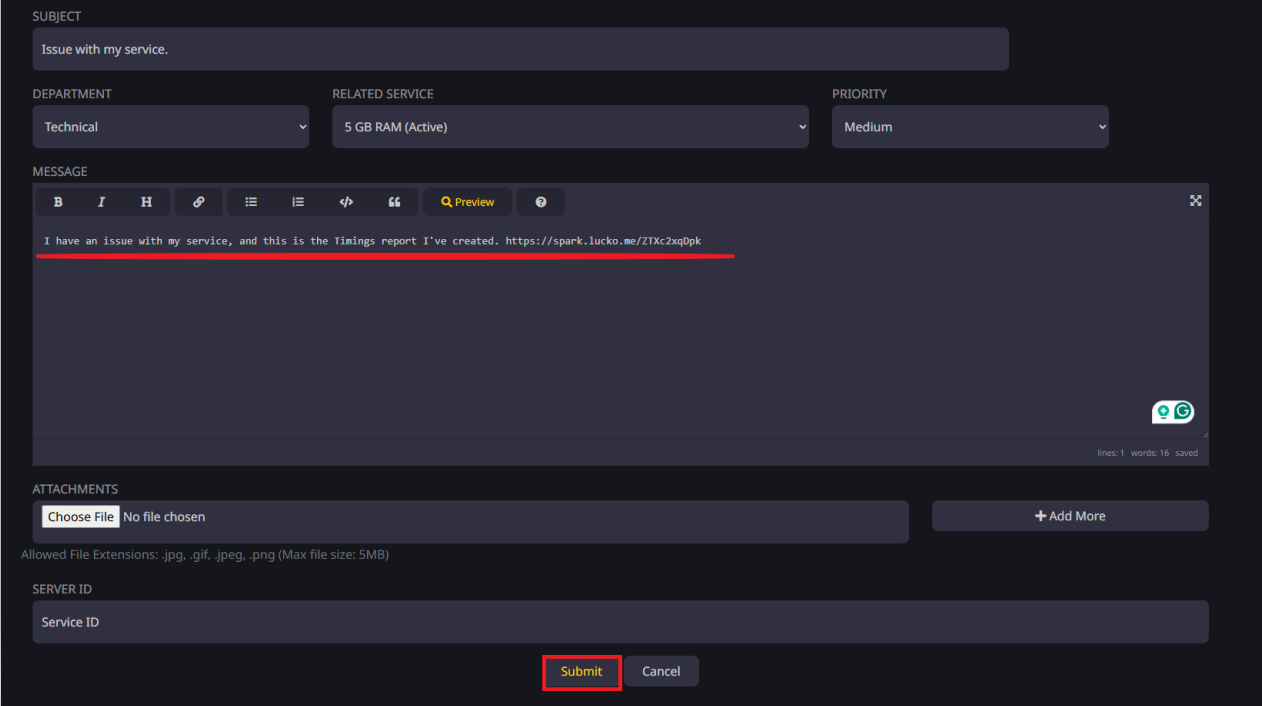
You will get a response as fast as possible!
Still have some questions?
If you need any further help, you can open a ticket here!
By: Hamza E.
Updated on: 12/11/2025
Thank you!